It has been well documented that companies maintaining continued success in public procurement, also enjoy more predictability in their cash flow, and are generally more financially stable in insecure times. As discovered in our 'Government Receivables as a Stock Market Signal' white paper, winning government contracts is also likely to have a positive impact on a company’s stock price.
Therefore, we thought it would benefit our readers if we offered them detailed analyses of the financial results these major government contractors achieve.
It is now time for us to look again at a company we covered previously in this series. Northrop Grumman recently reported its Q1 2023 results and below we will provide a brief analysis of the company’s performance in the first 3 months of the year.
Key points:
* 86% of Q1 sales to U.S. government. Fixed-price contracts accounted for 46% of Q1 sales while cost-type contracts were 54% of Q1 sales;
* 5.7% Y/Y revenue increase in Q1 (2022 +2.6%). 2023 outlook for 4.4% growth confirmed;
* Broad-based Q1 margin weakness on higher inflation and pension costs set to reverse in the remainder of the year;
* Backlog down 1.5% Q/Q as major tenders only expected in 2024 and 2025;
* Net debt of $12.3 billion with a target to return 100% of circa $2 billion free cash flow to shareholders.
Northrop Grumman Q1 2023 Results Overview
We originally covered Northrop Grumman's Q4 2022 results in part 10 of our Top Government Contractors series here. Below we will highlight the progress achieved by the company in Q1 of 2023.
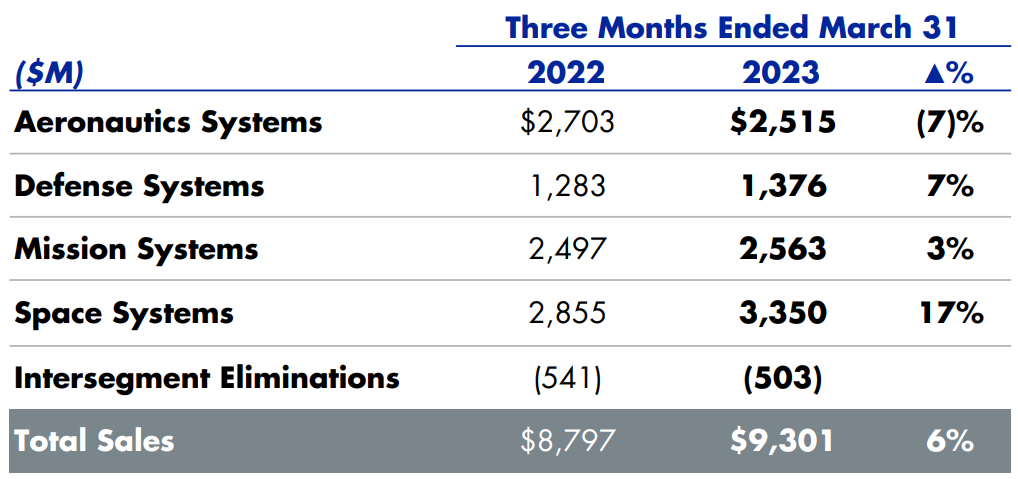
Northrop Grumman reports results in four main operating segments, namely Aeronautics Systems at 25.7% of Q1 2023 revenues, Defense Systems at 14%, Mission Systems (cyber, radar, sensors, communications and networks) at 26.1% of and Space Systems at 34.2% of Q1 2023 revenues:
Figure 1: Q1 2023 Northrop Grumman segment revenues

Source: Northrop Grumman Q1 2023 Results Presentation
Operational Overview
Aeronautics Systems was the only segment to register a Y/Y revenue decline in Q1 (-7%), in line with the 6.3% decline observed in 2022. The segment operating margin (OM) was 9.4%, weaker Y/Y and relative to 2022 (10.6%). As a result, operating income was down 23% Y/Y. The margin weakness was due to Estimate at Completion (EAC) adjustments relating to higher than anticipated inflation, while sales were down on lower volume in Manned Aircraft and Autonomous Systems.
The segment is expected to return to top-line growth in 2024 as new programs start and legacy ones leave the Y/Y comparison.
Defense Systems was the second best performing segment, with sales up 7.2% Y/Y in Q1 (2022 down 3.4%). The Q1 OM was 11.6%, down Y/Y and relative to 2022 /11.9%/. All in all, the Q1 operating income increased 3% Y/Y. As with the Aeronautics segment, EAC adjustments weighed on margins. Revenue growth was driven by both business sub-segments (Defense is subdivided into Battle Management & Missile Systems and Mission Readiness).
Mission Systems revenues were up 2.6% Y/Y in Q1, building on the 2.6% growth achieved in 2022. The OM was down to 14%, weaker Y/Y and relative to the 15.6% in 2022. The combined effect drove operating income down 6% Y/Y. Margin weakness was due to shifting mix while sales increased across all four business areas.
Space Systems was the best performing segment in the quarter, with sales up 17.3% Y/Y in Q1 (2022 +15.7%). It was the only segment to achieve Y/Y margin growth to 9.3%, although slightly falling below the 9.4% OM in full-year 2022. Nevertheless, operating income grew 20% Y/Y. Margin strength was centred in the Launch & Strategic Missiles business area, while revenue growth was underpinned by the Space business area as well.
On a consolidated basis, revenues increased 5.7% Y/Y in Q1 (2022 +2.6%), the segment operating margin slipped 1% Y/Y to 10.8% (2022: 11.6%), driving segment operating income down 3% Y/Y. Free cash flow was negative $1 billion. Adjusted EPS was $5.5/share, down 10% Y/Y. EPS suffered from a smaller pension benefit, which is expected to grow again in 2024.
Updated 2023 Outlook
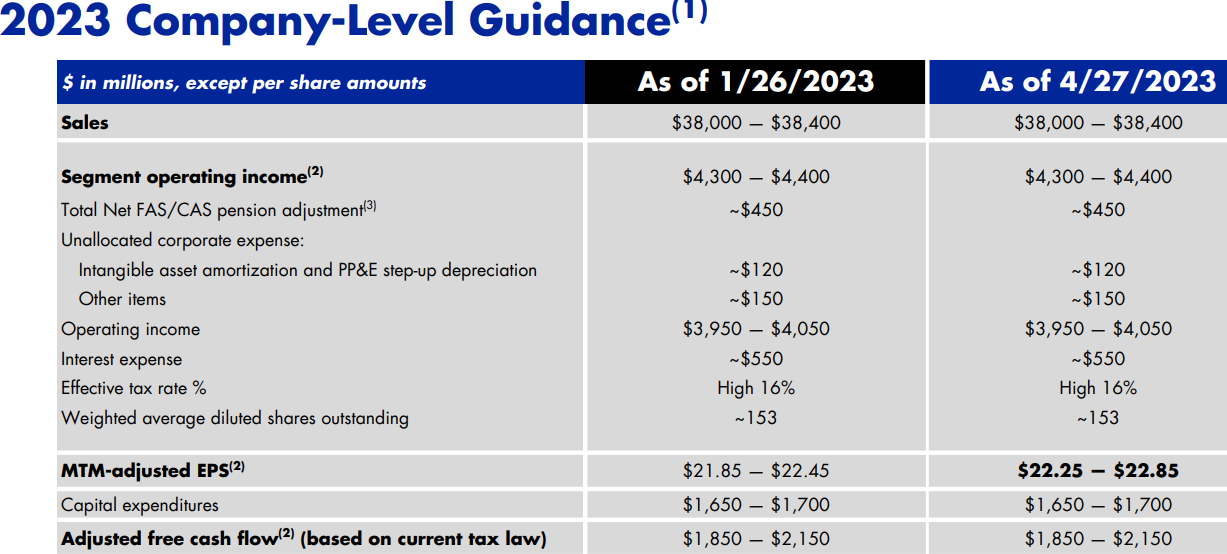
As Q1 performance largely met initial expectations, Northrop Grumman only boosted its adjusted EPS guidance by +1.8% to $22.25-22.85/share (2022: $25.54/share) to reflect a business disposal:
Figure 2: Northrop Grumman Updated 2023 Outlook

Source: Northrop Grumman Q1 2023 Results Presentation
- Revenues is expected to increase by 4.4% to 38.2 billion
- Adjusted free cash flow is forecast at around $2 billion, despite weak Q1 cash conversion.
Q2 sales are seen in line with Q1, before accelerating in Q3 and Q4.
Backlog
Total backlog slipped 1.5% Q/Q to $77.5 billion and the company forecasts a book-to-bill of just under 1.0x for 2023. No major awards are up for grabs in 2023, with an increase in tenders expected for 2024 and 2025.
Capital Structure
Northrop Grumman ended Q1 with a net debt of about $12.3 billion against a market capitalization of $67 billion. The debt is expected to remain constant as the company plans to distribute 100% of free cash flow to shareholders in 2023:
“...we initiated a $500 million accelerated share repurchase in the first quarter. And including our open market repurchases, we'll repurchase roughly $720 million of stock in the period. We also raised $2 billion in new notes in the first quarter at attractive rates, which we anticipate using in part to retire the $1 billion of notes that are maturing in Q3.”
Conclusion
Northrop Grumman boosted capital expenditures by 27% in Q1, laying the foundation for strong cash flow generation in 2025 and its >$3 billion free cash flow target. As programs mature and move from development to production, the company expects further free cash flow and margin growth in the latter part of the 2020s.
Although all segments delivered operating margins below 2023 targets, performance is set to improve as the temporary headwinds such as EAC adjustments and lower pension income fade. Management noted inflation has slowed down and supply chain issues have moderately improved.
Fixed-price contracts made 46% of all Northrop Grumman sales in Q1, down from 50% in Q1 2022. The company may benefit from funds allocated for inflation relief for such contracts. Cost-type contracts currently account for 54% of all revenue.
In light of the fact that 86% of Northrop Grumman sales were to the U.S. government in Q1 2023, monitoring the company’s public procurement activity remains a smart move that can provide key insights into Northrop Grumman’s financial health.
To learn more about the ways in which TenderAlpha can provide you with insightful public procurement data, get in touch now!
This article was written by members of TenderAlpha's team and does not serve as a recommendation to buy Northrop Grumman or any other stock. TenderAlpha is not receiving compensation for it and we have no business relationship with any company whose stock is mentioned in this article.
