
An alternative trading strategy based on forward-looking government receivables from TenderAlpha's global public procurement database generates improved performance in 2020. The main strategy in our 'Government contracts data and stock price movements – signal testing' white paper is based on the signal we term 'unexpected government receivables' that is constructed as follows:
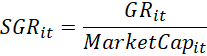
1. At the end of each month t, for each stock i, we scale the forward-looking government receivables (GR) by the stock’s market capitalization and arrive at the "scaled government receivables":
2. The "unexpected government receivables" (UGR) are the "normalized" scaled government receivables (SGR), where the normalization is done by subtracting the average SGR over the previous year (μ(SGR(t-12,t-1) )) and dividing by the standard deviation of SGR over the previous year (σSGR(t-12,t-1) ):
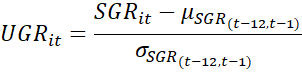
While the strategy based on UGR performed exceptionally well until 2020, the sharp downturn and quick upswing in the market following the advent of the pandemic results in significant turnover in the portfolio essentially unrelated to forward-looking receivables. As a result, TenderAlpha has backtested and found alternative signals which continue to perform exceptionally well during 2020.
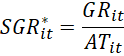
The main improvement in the new signals is that instead of scaling by market capitalization, we now scale forward-looking government receivables by accounting variables retrieved from the stocks’ annual financial statements. This avoids incurring portfolio turnover from sharp swings in the market essentially unrelated to the stocks’ receivables. Additionally, due to the static nature of the scaling variables (annual accounting data is published only once a year), we only subtract the mean scaled government receivables over the last year. An example strategy is calculated as follows:
1. At the end of each month t, for each stock i, we scale the forward-looking government receivables (GR) by the stock's total assets (AT) from its most recently published financial statements and arrive at the "scaled government receivables":
2. The "unexpected government receivables" (UGR) are the difference between the scaled government receivables in a given month (SGRit*) and the average SGR over the previous year (μSGRt-12,t-1*):
![]()
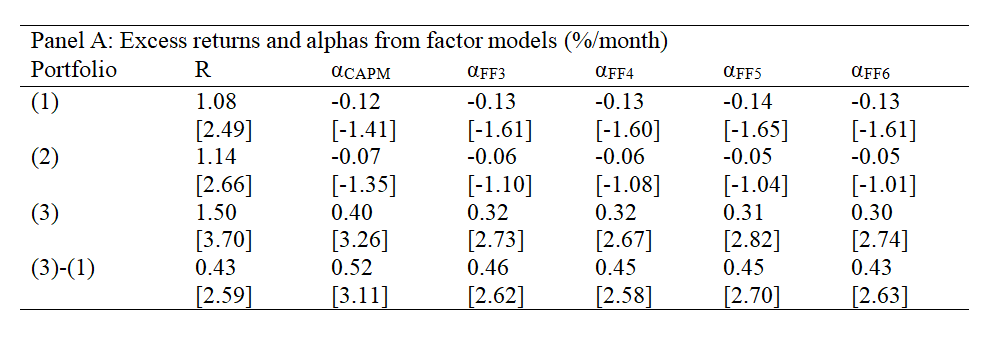
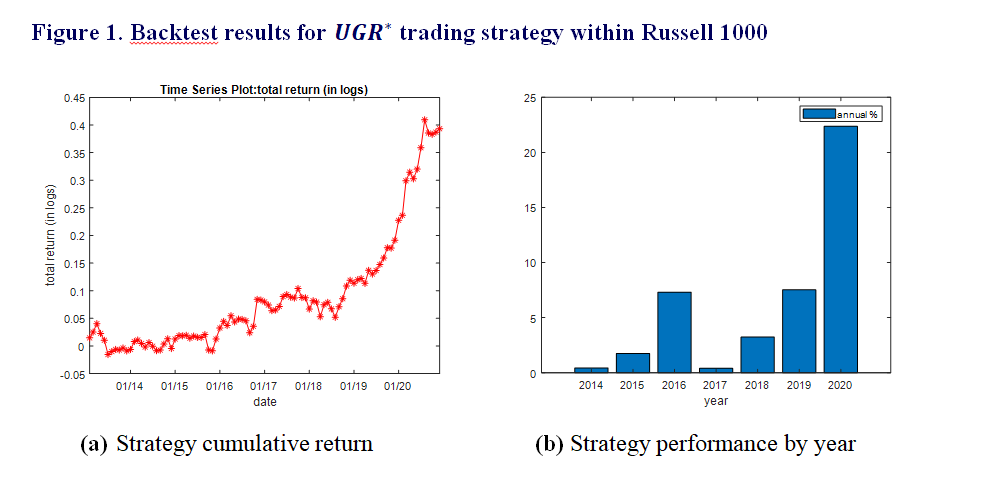
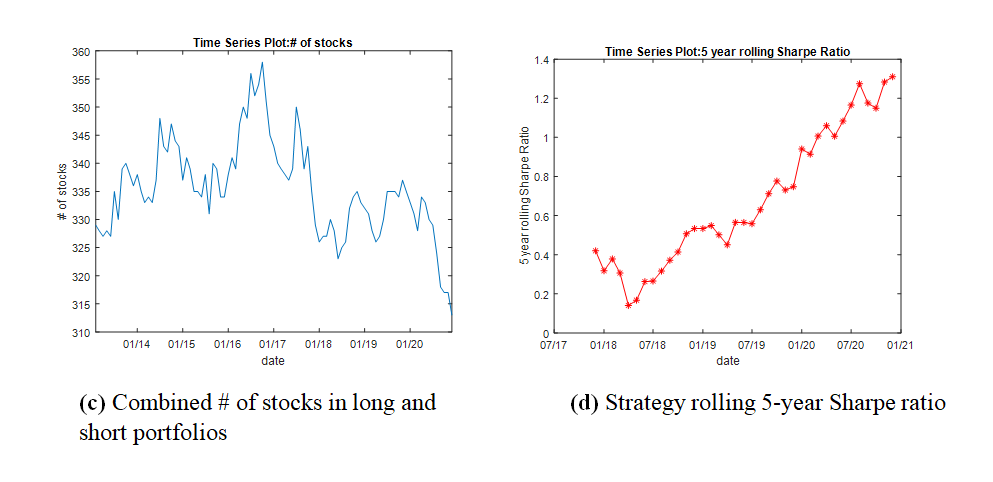
Given the UGR* signal, in each month the strategy takes positions in stocks with positive UGR* and shorts stocks with negative UGR*. Table 1 shows a backtest of this strategy executed within the Russell 1000 universe that includes results for 2020. The strategy takes short positions in about 200 stocks on an average month and long position in about 140 stock on average. The average returns and alphas range between 43 and 52 basis points per month, with t-statistics exceed 2.50 in all cases. Figure 1 shows that the strategy perform well throughout the entire sample, and its performance in 2020 is especially noteworthy.
Alternative constructions of SGR*it, such as scaling by total revenues instead of total assets, also produce significant returns.
Table 1. Backtest results for UGR* trading strategy within Russell 1000
This table shows backtesting results for a trading strategy that goes long stocks with high unexpected government receivables and short stocks with no government receivables. The table reports average returns (r) and alphas on five different factor models (α’s) in Panel A, and factor loadings on the factors in the Fama and French (2018) six-factor model (β’s) in Panel B, for portfolios formed based on their unexpected government receivables variable, UGR, and defined as follows:
- Portfolio (1) is firms with negative UGR*
- Portfolio (2) is firms with UGR*=0
- Portfolio (3) is firms with positive UGR*
- Portfolio (3)-(1) is a portfolio that goes long stocks in Portfolio (3) and short stocks in Portfolio (1)
Stocks are value-weighted within portfolios and the portfolio holdings are rebalanced at the end of each month. T-statistics are reported in brackets. The sample includes all stocks in the Russell 1000 index and the period is from January 2013 – December 2020.