
We recently highlighted the significance government contracts have for the largest U.S. defense companies.
In this article, we broaden our focus and highlight U.S. government contractors operating in the Healthcare, IT & Services, and the Industrial sectors.
While still doing business with the Department of Defense, the companies in our selection are more diversified in their government procurement activities.
As a result, they have not experienced the rapid sales growth due to geopolitical tensions observed in our previous article.
At the same time, the companies in our selection are more exposed to commercial sector dynamics. This usually boosts their results in an economic upswing as the one we are experiencing currently.
Should the US economy experience a recession, however, government contracts may prove to be a lifeline as they are more reliable than the ebb and flow of the commercial sector.
So far in 2024, US nominal government spending is growing at an 8% nominal rate compared to 2023.
In fact, 2024 will be the first year government spending grows year-over-year since 2021, which saw 53% higher nominal spending compared to the pre-pandemic 2019, followed by lower spending in both 2022 and 2023 as COVID-19 expenditure wound down:
Figure 1. Annual change in US nominal government spending
|
Fiscal Year |
Annual Change |
| 2024 - year-to-date | 8% |
| 2023 | -2% |
| 2022 | -8% |
| 2021 | 4% |
| 2020 | 47% |
| 2019 | 8% |
| 2018 | 3% |
| 2017 | 3% |
Source: TenderAlpha.com
Looking at Figure 1 above, we can observe that government spending is back to its pre-pandemic growth rate of about 8%. Should inflation moderate as expected, we may well see a further deceleration in government spending growth, roughly to the 3% annual change observed in 2017 and 2018.
To investigate some of the companies benefitting from the increased government spending, in this article, we analyze the top healthcare, IT & services, and industrial government contractors with respect to their Q1 2024 quarterly results and the significance of government procurement for their revenue.
Top Healthcare Government Contractors
Q1 2024 Revenue developments
We divided the six healthcare companies in our sample between drugmakers (Pfizer, Roche), pharmaceutical distributors (McKesson, Cencora, and Cardinal Health), and health insurance (Humana). In the table below we present the Q1 2024 Y/Y revenue growth of our selection:
Figure 2. Q1 2024 revenue trends at large healthcare U.S. government contractors
| Company | Revenue growth Q1 2024 |
| McKesson | 11% |
| Humana | 11% |
| Cencora | 8% |
| Pfizer | -20% |
| Cardinal Health | 9% |
| Roche | -6% |
| Average growth rate | 2% |
| Median growth rate | 9% |
Source: Company disclosures for Q1 2024
Across the six companies in our list, top-line growth came in at 2% on average, but when we consider the median growth rate of 9% we see the outsized effect the decline in COVID-19 sales at drugmakers such as Pfizer and Roche is having on the sector.
From a sub-sector perspective, the results varied significantly across our selection:
- Drugmakers (Pfizer, Roche) saw an average decline of 13% Y/Y in Q1 2024 sales, with growth in non-COVID-19 treatments still not sufficient to offset the decline in COVID-19 sales.
- Pharmaceutical distributors (McKesson, Cencora, and Cardinal Health) grew sales by 9% Y/Y in Q1 2024, with strength concentrated primarily in the home U.S. market, as well as services.
- Health Insurance (Humana) was the fastest-growing segment, at 11% Y/Y, helped by higher interest rates and underlying operating momentum, notwithstanding margin pressures due to low reimbursement rates.
Healthcare Government Revenue Share
In the table below, we show the significance of U.S. government revenue for the companies that have sufficient disclosure in their Q1 2024 filings:
Figure 3. Share of company revenue attributable to the U.S. government
| Company | US Government Revenue Share Q1 2024 |
| Humana | 86% |
| Pfizer | 10% |
Source: Company disclosures for Q1 2024
We observe that while all companies in our selection are awarded substantial government contracts, only Pfizer and Humana have sufficient disclosure with regards to the exact amount they derive from the U.S. government alone.
We should also note that international sales are quite important to drugmakers such as Pfizer and Roche, taking their cumulative government exposure higher than the figure reported for the U.S. government alone, which in the case of Pfizer stands at 10%.
In the case of Humana, the 86% government exposure is representative of its cumulative government share as the company only provides Medicare coverage in the United States.
If you want to learn more about the underlying dynamics driving the healthcare sector, you can also read our full Pfizer Q1 2024 analysis here.
Top IT & Services Government Contractors
Q1 2024 Revenue developments
We divided the eleven companies in our IT & services sample into two main groups, namely hardware IT (IBM, HPQ, Dell) and Professional services (SAIC, HPE, Accenture, Capita, Serco, Jacobs Solutions, Sodexo, Atos) companies, notwithstanding some overlap in certain activities among the two groups. Here is how the eleven companies performed Y/Y in Q1 2024:
Figure 4. Q1 2024 revenue trends at large IT & Services U.S. government contractors
| Company | Revenue growth Q1 2024 |
| IBM | 1% |
| SAIC | -12% |
| HPQ | -1% |
| HPE | 3% |
| Accenture | 0% |
| Capita | -9% |
| Dell | -11% |
| Serco | 7% |
| Jacobs Solutions | 5% |
| Sodexo | 5% |
| Atos | -7% |
| Average growth rate | -2% |
| Median growth rate | 0% |
Source: Company disclosures for Q1 2024
Looking at Figure 4 above, we observe that topline growth is very muted, at negative 2% on average, or 0% if we take the median of the eleven companies. Digging deeper across the two subsectors, we find that:
- Hardware IT sales declined 4% Y/Y during the first quarter of 2024, although we should note momentum is shifting with sales growth expected for the remainder of the year, with companies seen benefitting from elevated demand for AI hardware.
- Professional services dynamics were marginally better, as revenues fell 1% Y/Y in Q1 2024. Here too there are green shoots indicating a return to revenue growth, although it is hard to generalize trends for 9 distinct companies.
IT & Services Government Revenue Share
In the table below, we show the significance of U.S. government revenue for the companies that have sufficient disclosure in their Q1 2024 filings:
Figure 5. Share of company revenue attributable to the U.S. government
| Company | US Government Revenue Share Q1 2024 |
| SAIC | 98% |
| Jacobs Solutions | 31% |
Source: Company disclosures for Q1 2024
As we can observe from Figure 5 above, few professional services companies disclose the exact amount of business they do with the U.S. government. This is understandable since these companies serve governments around the world, benefitting from public procurement in more than one jurisdiction.
Hence, some companies with significant cumulative government exposure, such as Accenture at 15% of Q1 2024 revenue, or Capita at 58%, are not shown in the table since they only report cross-country government exposure, rather than individual U.S. government exposure.
Among the remaining companies, it is worth highlighting Jacobs Solution’s plans to spin off its government business with Amentum, creating a new independent, publicly traded company focused on serving government customers. The move highlights the value stable government contracts have on the valuation of a company.
Top Industrial Government Contractors
Q1 2024 Revenue developments
We divided the nine companies in our industrial sample into three main groups, namely Construction (Bouygues, Vinci, Morgan Sindall, Skanska), Industrial Conglomerates (Siemens, GE Aerospace, Honeywell), and Energy (Engie, Total Energies).
Figure 6. Q1 2024 revenue trends at large industrial U.S. government contractors
| Company | Revenue Growth Q1 2024 |
| Bouygues | 2% |
| Vinci | 5% |
| Morgan Sindall | 3% |
| Skanska | -2% |
| Siemens | -2% |
| GE Aerospace | 11% |
| Honeywell | 3% |
| Engie | -25% |
| Total Energies | -11% |
| Average growth rate | -2% |
| Median growth rate | 2% |
Source: Company disclosures for Q1 2024
Looking at Figure 6 above, we observe that Q1 2024 performance was quite polarized among the three subsectors:
- Construction companies delivered 2% average Y/Y revenue growth as they benefited from growing order books.
- Industrial Conglomerates saw 4% higher sales Y/Y, with companies exposed to the aerospace sector showing strength in particular.
- Energy companies were the weakest performers, as revenues declined 18% Y/Y on the back of lower energy prices.
Industrial Government Revenue Share
In the table below, we show the significance of U.S. government revenue for the companies that have sufficient disclosure in their Q1 2024 filings:
Figure 7. Share of company revenue attributable to the U.S. government
| Company | US Government Revenue Share Q1 2024 |
| GE Aerospace | 8% |
| Honeywell | 9% |
Source: Company disclosures for Q1 2024
From the data in Figure 7, we observe that only U.S. companies with a significant tilt to aerospace production have sufficient disclosure with regard to their U.S. government business. This is largely due to the fact that the remaining companies in our Industrial selection do business with a variety of governments all over the world. As a result, none of them readily report U.S. government exposure on a quarterly or even annual basis.
Analysis Between Sectors
Having observed revenue developments at large government contractors in the healthcare, IT & services, and industrial sectors, we will now summarize their Q1 2024 performance in Figure 8 below:
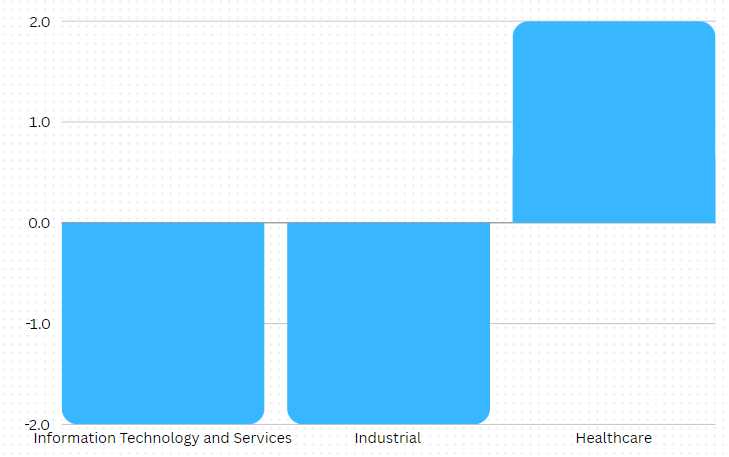
Figure 8. Q1 2024 year-over-year percentage change in revenues in the Healthcare, IT & Services, and Industrial sectors among large U.S. government contractors
Source: Company disclosures for Q1 2024
We observe that out of the three sectors in our coverage, Healthcare stands out in Q1 2024 with 2% Y/Y revenue growth, while IT & Services and the Industrial sector both declined by 2% relative to the prior-year quarter.
When compared to the defense sector in our previous article, we see that all sectors fall short of the 8% Y/Y revenue growth achieved by defense contractors.
Looking into the rest of the year, growth should pick up in the IT & Services sector. As the declines in the Industrial sector were driven by companies with high energy price exposure, the outlook for the sector is less certain.
Conclusion
After declines in aggregate spending in 2022 and 2023, the U.S. government’s current fiscal 2024 expenditures are growing at some 8% Y/Y. From the three groups examined in our analysis, this is most visible in the Healthcare sector, with growth in the other two sectors negative due to idiosyncratic factors related to the particular industry.
Looking into the remainder of 2024, we expect growth to pick up in the IT & Services industry, with the outlook for the Industrial sector more nuanced, with strength in aerospace offset by weakness in energy.
The persistent increase in U.S. government spending will inevitably result in higher government procurement orders for the companies in our selection. To be the first to know about the latest contracts awarded in the United States, check out our daily-updated Government Contracts Awards Feed.